


When it comes to your customers, few things are worse than churn.
Never having a customer? That’s obviously less than ideal. But having a paying customer cut ties and leave you? That’s rejection. That stings.
You’ve invested time, energy, and money into getting them in the first place, and then they get up and go.
And if that’s not bad enough, you’re probably familiar with the ubiquitous stats about cost of acquiring versus cost of retaining (but just in case you’re not):
- Acquiring a new customer can be anywhere from 5-25x more expensive than keeping an existing one
- The probability of selling to an existing customer is 60-70%, while it’s only 5-20% for a prospect
- Increasing your retention by only 5% can increase profit by 25-95%
- Improving your retention has 2-4x more impact on growth than acquisition
Good business is all about keeping the customers you have. That should be your top priority.
The mobile app arena is no different. Marketers and companies once looked at number of users and total installations as evidence of success. One million downloads? Yippee!
But installing an app is not the end of the story. In fact, 23% of users uninstall an app after using it just once. That’s about one in four. Their download still goes into the tally, but no one would call that a happy ending.
Churn in the app world can be devastating. Like any business, you’ve got to measure and manage your churn rate. And the best way to “manage” it is to reduce it.
Here are five ways to do just that.
Churn Rate?
Before we go any further, though, let’s get everyone on the same page.
The churn rate is the percentage of paying customers or users that break ties with a company during a defined period of time, typically by month, quarter, or year (the opposite is the retention rate, or how many customers stay).
Tracking the churn rate is a great metric for quickly assessing overall health: if it’s going down, whatever changes you made are working. But if it’s going up, it’s time to head back to the drawing board.
The formula for calculating it is very simple: the number of customers who left during a set period divided by the number at the start. That’s it.
Number of Customers Who Left
Number of Customers At Start
Now, I should point out a couple of things here:
- Churn is what’s known as a lagging indicator, meaning it’s already happened. Many consider that a serious drawback. By the time you see your churn rate go up, you’re already anywhere from a few weeks to a few months past when you failed your customers in some way.
- This type of churn calculation works very well for subscription services and other monthly or annual recurring fees, but gets a bit more complicated when it comes to, say, ecommerce. They require more complex formulas. Some ecommerce platforms, for example, adhere to the assumption that most repeat customers return within X days (varies depending on the niche) of their first purchase, so anyone not buying again in that timeframe is labeled as having “churned”.
The good news? Measuring churn in the app world is pretty straightforward: number of active users who left divided by the total number at the start of the time period.
If you’re using mobile app analytics (which of course you are), collecting that data is easy-peasy. Your options include Google Analytics for Mobile Apps, Localytics, Adobe Analytics, App Annie, and Mixpanel.
Generally speaking, churn should not be the only metric by which you measure user satisfaction. A customer happiness index is becoming a pivotal tool for many businesses, regardless of industry, product, or niche.
Because a happy customer rarely if ever leaves. Make sure they’re happy. That’s half the battle.

A happy customer = a loyal customer
With it, you collect and analyze customer satisfaction data using questions, rating scales, surveys, and various other methods. It can be very basic, or more extensive, depending on your particular objectives.
You can outsource to a third-party service like The Happiness Index, or do it yourself. But do it you must. Another method to consider is the Net Promoter Score. This one is widely used and loved because of its simplicity: one question, a sliding scale, and an easy calculation. You can even set it up within the app itself.
Churn coupled with satisfaction or happiness data gives you a well-rounded and complete snapshot of how you’re doing overall.
But back to churn…
The Problem with Churn
Churn can easily be misconstrued and misused.
For starters, remember to treat it as an indicator, and not just a stat. You need to consider the story behind the number. What is your app doing or not doing to facilitate the churn you’re seeing?
Second, realize that there is no magic number. A churn rate that is acceptable and sustainable depends a great deal on your industry, business model, how fast you can generate new leads and customers, and the timeframe for a new customer to become profitable.
Finally, appreciate that churn is only one metric, and you can turn things around. Reducing your churn rate even a little can have a major influence on your revenue growth over time…even more than focusing on acquisition.
Churn in the App World
Apps are big business. As the saying goes, “there’s an app for that”. And in all likelihood, there literally is an app for everything you can imagine.
Google Play leads with roughly 2.2 million apps for the Android OS, while the Apple App Store is not far behind with 2 million. Both are growing by more than a thousand each day.
That’s a lot of app candy to entice users.
Unless your app requires a monthly subscription fee, when you’re talking about churn, you’re talking about inactivity.
App churn = inactive during a particular time period (usually a month).
Localytics discovered a clear negative correlation between app sessions and user churn. The higher the number of sessions in the first 30 days, the less likely the churn in the following month:
- One app session in first 30 days? 75% chance of churn.
- 11 or more app sessions in first 30 days? 14% chance of churn.
The secret sauce, then, would be to guarantee as much engagement as possible in that first month. Get them past the 11 session mark, and you’ve likely got them hooked.
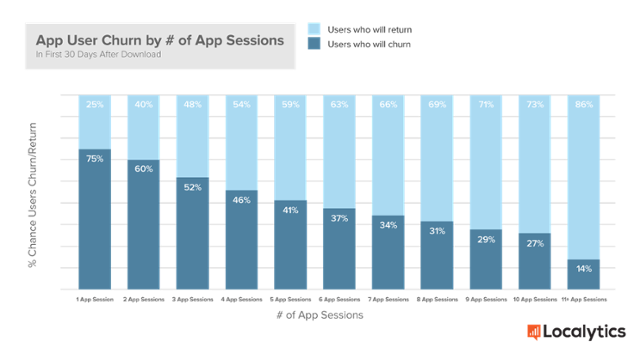
Image Source: Localytics
But that’s easier said than done (why does it always have to be easier said than done?!).
Engagement leads to better retention. Full stop.
App user retention – defined as those that return to the app at least eleven times – rebounded slightly in 2016 to reach an overall average of 38%. And while that may look decent, the math paints a less-than-awesome picture: that 38% retention rate means 62% of users are turning to your app – programmed with your blood, sweat, and tears – less than eleven times.
No one sets out to create an app that people use only ten, or five, or one time.
To combat churn and increase retention – the holy duo of appdom – Localytics promotes what they call the 3×3 Rule. Their research shows that if you can get users to engage with your app three times in the first three days after installation, you reduce your churn rate to an acceptable 29% (down from the 58% average in that first month).
Three sessions. Three days.
That’s the key. Increase engagement. Reduce churn. Let’s do this. Try these strategies for success in the appverse.
Strategy #1 – In-App Messages
The results are in: app users read and appreciate in-app messages.
And because they’re part of the app itself, they don’t require a user to opt-in. Everyone who installs is already onboard. You’ll reach virtually everyone.
Furthermore, you’ll be communicating with them when they’re already engaging with you (the messages are triggered only when the app is opened). They’re primed to receive your message…whatever it is.
Industry research found that apps with in-app messaging see 46% of users engage 11 or more times (the standard benchmark for retention) versus only 36% for apps that don’t use it.
So use it.
When drafting your onboarding or first session, the inclusion of in-app messaging leads to better engagement and user experience. Many providers (like Urban Airship, for example) even allow for action buttons within the messages so users can pick and create their own user path through the app. This allows for the kind of personalized journey that users expect in the 21st century.
Apps with in-app messaging see 3.5x better retention. That alone is reason to include it.
A carefully crafted in-app messaging strategy is an absolute must if you’re serious about success and reducing churn. Onboarding. New feature introductions. Customer service. Promotions. Transactional and triggered messages. And more.
Do it right, and you’re guaranteed to see a retention rate lift.
Strategy #2 – Push Notifications
Similar…but different.
Push notifications allow you to send messages to users even when they’re not using the app, or their device for that matter. Once they opt in, the notice is typically your app icon appearing in their status bar, and/or your message on the lock screen.
These messages are guaranteed to reach users. They won’t get sorted to a spam folder. And the open rate tends to be much higher – often twice as much – than traditional email. Use them for all the same reasons as you would in-app messaging.
Both Apple and Android support push notifications, and both allow for action and interactive buttons (users can respond directly, or take an immediate action). And you can even segment your notifications down to a single user! The only difference between the two is that iOS requires a manual opt-in (you need to get permission…consider creating an engaging, creative in-app message to get that crucial agreement), while Android doesn’t.
Check out Urban Airship’s top ten tips for successful opt-ins.
And here’s the best part: apps with push notifications turned on see retention rates as high as 49%, and an average click rate of 8.1%. And even though in-app messages see a CTR double that at 16%, eight percent is still eight percent.
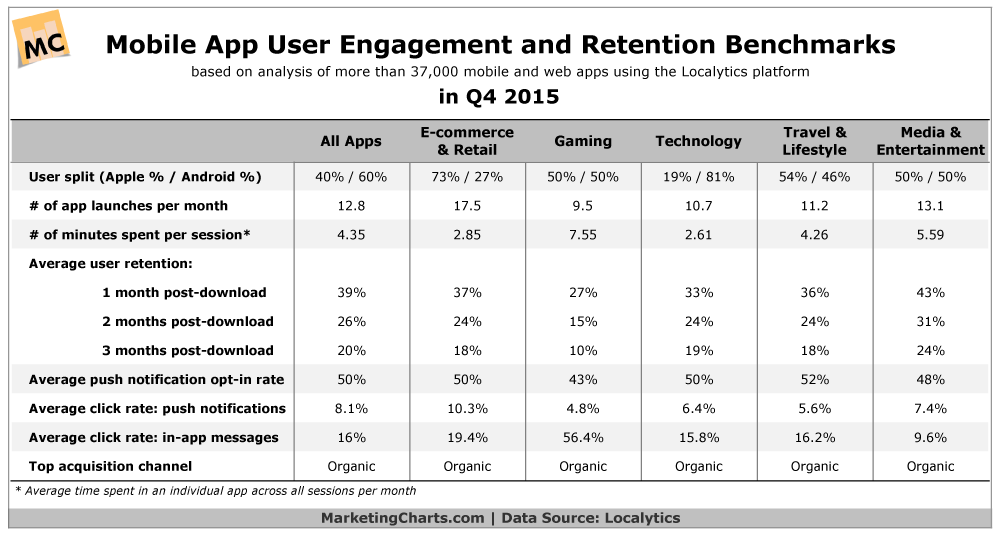
Image Source: MarketingCharts
And it doesn’t stop there. Localytics found that users with push enabled launch an app an average of 14.7 times per month (remember that pivotal 11 times threshold) versus only 5.4 times for those without it.
Your best strategy involves using both push and in-app. Follow the accepted wisdom for the medium (personalize, segment, engage, don’t inundate, and lean on user profile and behaviour for the highest open rates), and you’re bound to see retention up, and churn down.
Ultimately, users want communication. Push without being pushy gives them just that: targeted, relevant messages.
Strategy #3 – Remarketing
Remarketing is a great way to reconnect with users who have installed your app, but then stopped actively using it for some reason. Maybe they have push notifications enabled, maybe they don’t.
With remarketing, it doesn’t matter. You reach out to them via email (if you have it), social media, or paid ads. You remind them what your app has to offer, why you’re better than the rest, and the benefits (always the benefits) to them. Sell yourself. Toot your own horn.
The key is to remarket at new users in their favourite online hangouts. Forrester Research found that the average smartphone owner engages with 24 different apps per month, but spend up to 80% of their time in just five apps (including Facebook, YouTube, and Gmail). That’s where you want to connect with them. Where is your target audience most likely to be spending their digital days?
And if that’s enough, AppsFlyer discovered that mobile app retargeting results in a 62% lower cost to generate a lead (i.e. get your new user back into the fold).
Track user behaviour with your preferred app analytics platform, and retarget those that have fallen by the wayside. Remarket and get that churn rate down, down, down.
Strategy #4 – Track the Reasons Why
Knowing how many are leaving is good (that’s your churn rate), but you need to identify the underlying reasons why for it to have any meaning.
Lost 127 users this month? Okay. So what? You can’t do anything unless you know what drove them away. Only then can you take steps to turn things around.
A good place to start is Google Analytics (or whatever equivalent service you’re using). Check out the behaviour section, paying particular attention to the screens report. Here, you can track screen views, average time on screen, percent of users who exited on screen, and more. Are you seeing any one specific screen lose the majority of users? Fix it. Improve it. Make it better. Stop that leak.
Move on to timings reports (are screens taking too long to load?), events tracking (what ads, menus, purchases, and videos are getting the necessary attention, and which ones are being shunned?), and the crashes report (too many and your users will leave you).
Remember the old adage: that which gets tracked and measured, gets managed. So track. Measure. And manage. Collect and analyze the metrics that matter to inform and guide your decisions and strategy.
Finally, consider the typical reasons for uninstalling, such as:
- Too many/bad/annoying messaging
- Better competitor
- Privacy concerns
- No/poor onboarding
- Data usage too high
Are you optimized and following best practices in each of those areas? If not, get to it. And if you’re not sure why someone left, find out. Consider using an uninstall survey or quick question to get the main reason someone is breaking up with you. (and if they say “it’s not you, it’s me”, don’t believe them…it’s you).
Find. Out. Why. And then use that data to get better (as a person, company, and app).
Strategy #5 – A/B Test
We know to A/B test our website, our landing pages, our PPC ads, our email campaigns, and more.
Why, then, would you believe your app is any different? A/B testing allows you to incrementally and consistently improve your offering, slowly but surely turning it into the perfect app that your audience just can’t live without. Satisfaction up. Churn down.
Don’t A/B test, and you’re basically guessing. Business is no place for guessing.
Test the CTA on various pages and screens. Different copy, different placement, different color, different button. What resonates with your user base?
Test navigation menus: placement, list vs dropdown, screen icons, and more.
Test long scroll versus click-through to the next screen.
Test steps in a process and the guidance for each step. More instruction, less instruction, fewer steps, more options. User paths are rather personal, and providing some choice may increase completion, happiness, and retention.
Come up with hypotheses for improvement…and test.
Services like Apptimize and Leanplum make A/B testing your mobile app fast, simple, and convenient.
And don’t forget to experiment outside of the app environment itself. Test your app store pages. Test your user acquisition channels. Test your messaging.
A mobile app testing strategy is as important as any other. Make it a cog in your app wheel.
There’s so much you could do to reduce churn. Personalization. Kickass Onboarding. Better communication.
Too many of us consider churn as an inevitable part of doing business. While that may be true to some degree, you can take active steps to control it. Measure, track, and manage.
Look at your churn rate at a segmental level in addition to your overall base. How many millennials are you losing? How successful are you at keeping those 65 and older happy? What insights can you take from each segment and apply to others?
When it comes to your business – your website, your product, your app – you should never leave well enough alone. What works? What doesn’t? How can you improve?
Compare yourself against the industry average and benchmarks. If you’re already performing above, be happy. And then aim to get better. If you’re below, be concerned. And then aim to get get better.
There’s a lot you can track when it comes to your mobile app: retention rate, churn rate, daily and monthly active users, daily sessions, lifetime value, and more. It’s your job to stay on top of them all. Used collectively, they give you the hard data to combat churn, boost your retention, and make your users happy, satisfied, and loyal to a fault.
That’s what you want. That’s what they want. Everyone wins. You want a connection with them, right? You have to earn that.
So go. Earn. Give them the app they deserve…and the one that reflects your brand. Top-notch. Exceeding expectations. And invaluable.
What steps have you taken to control app churn? What lessons have you learned along the way? Leave your comments below:
Images: Pixabay, Localytics, MarketingCharts