


Welcome to the new frontier: the online channels and tactics you use to reach people around the corner and across the globe. Social media, email, PPC, and content are the digital arenas where savvy brands battle for supremacy. It’s a brave new world.
Businesses are throwing buckets of time, money, and effort at digital, but not enough are tracking whether it’s boom or bust. That fancy infographic series looks great. Those email newsletters seem quite popular. You’ve got 50,000 followers on Twitter. And?
No one wants to be left behind. Consumers have migrated to the web, so businesses are diving right in…and plan to learn how to swim later. That’s a great way to drown, not succeed.
(Image Source)
Forrester Research predicts that digital marketing spend in the United States will exceed $103 billion (yes, billion) by 2019, surpassing broadcast and cable television spend combined.
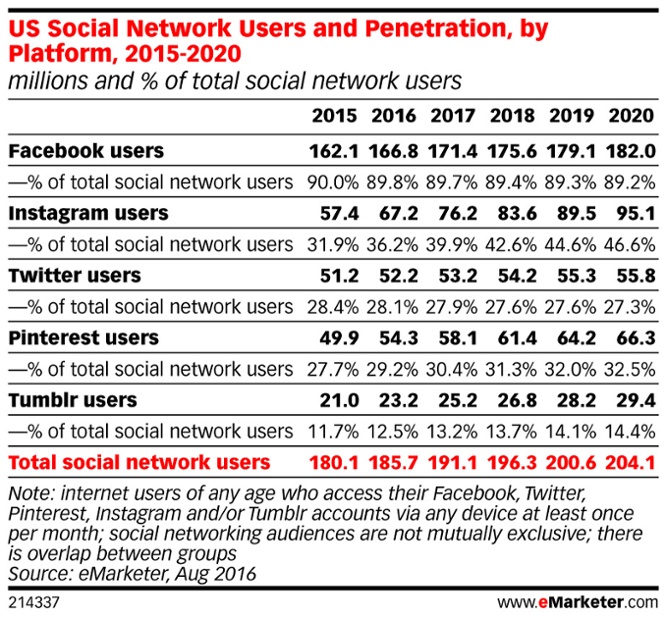
Worldwide social media users will grow from 2.34 billion this year to an estimated 2.95 billion by 2020. 69% of respondents to a Hanapin Marketing survey plan to increase their Facebook ad spend in the next year.
And 75% plan to increase their Adwords budget in that same period.
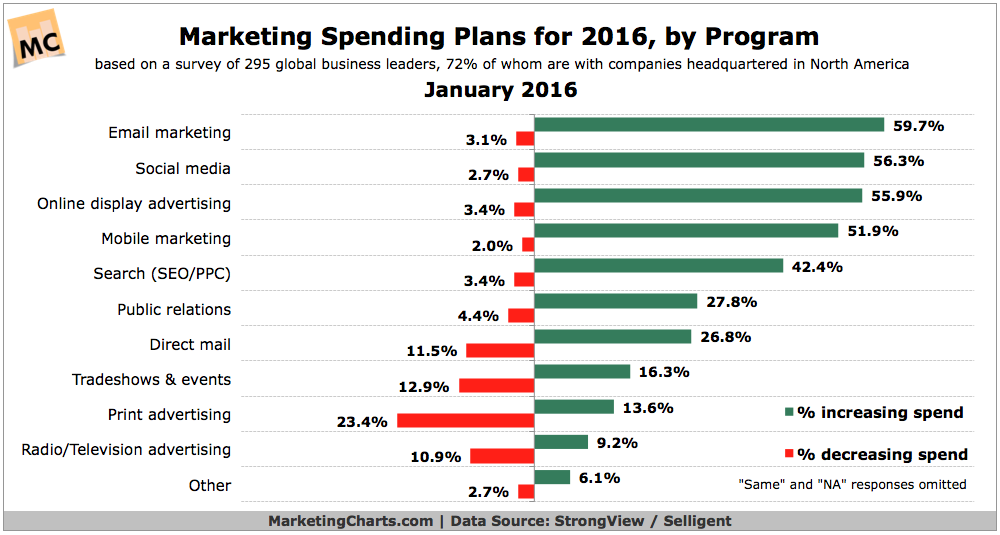
Econsultancy’s Marketing Budgets Report 2016 found that 15% of surveyed businesses plan to spend at least 71% of their total marketing budget on digital channels (with a full 6% planning to spend over 90% of their budget there).
It’s all very popular and trendy. And everyone wants to be seen as hip.
Digital Marketing: Good. But How Good?
We’re all in a terrible rush to capitalize on the digital revolution. Businesses have their Facebook Page, Instagram feed, Snapchat account (although they might not admit it), company blog, email list, and PPC ads. They’re good to go.
Except not really. The problem with all this digital marketing buzz is that not enough know how to evaluate its effectiveness.
90% of global marketers just don’t know how to determine return on investment (ROI), and 80% have little clue whether each channel, each campaign, each promotion is efficient or not. To quote Buddy the Elf, that’s shocking. Most marketers still cling to the belief that awareness, fans, clicks, followers, likes, retweets, and hearts are reward enough for their efforts.
It’s not. Likes and hearts don’t pay the bills. You need to look at the revenue coming in, the cost to acquire each new customer, their lifetime value to you, and the balance (or imbalance) between everything.
And if you want to get really fancy, what’s the viral coefficient (the number of new users or customers that an existing one generates) for each customer you get through your digital marketing?
Your online efforts can generate revenue, leads, and awareness. But the crucial question is whether it’s efficient or not. Are you getting maximum bang for minimum effort and expense?
Return on investment is just one key metric to monitor for obvious reasons. You need to bring in traffic, yes, but more importantly, you need to convert them for LESS than they’re worth to you.
Are you doing that? Can you find out? Let’s dig a little deeper.
(Image Source)
The Law of Growth
Called the Fundamental Law of Growth by some, the Golden Ratio by others, and confusing to most, you need this statistic in your pocket.
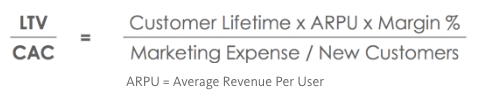
CLV / CAC > 3. That’s it. That’s all you really need to know.
It may not look like much, but find yourself outside its golden parameters, and you’ll quickly be in trouble.
Let’s break it down: CLV stands for customer lifetime value. It’s the expected average amount that a paying customer is worth over the duration of their relationship with you. There are many formulas for finding it, with varying degrees of complexity.
Customer Lifetime Value
At its simplest:
CLV = ((T x AOV) * AGM) * ALM
In this ballpark formula, T stands for the average number of monthly (or yearly) transactions, AOV is the average order value, AGM is your average gross margin (the total revenue minus the cost of the goods sold divided by the total revenue and multiplied by 100 if you want to express it as a percent. Try a GM calculator if math isn’t your thing), and ALM is the average lifespan of a customer in months (or years if you go that route…just be consistent).
Customer Acquisition Cost
CAC is the customer acquisition cost. It provides a dollar amount for how much each new customer cost you for a particular campaign or channel.
And it’s even easier to calculate:
CAC = TMC (total marketing cost) / TNC (total new customers).
Quick Bit – Marketing costs can include many elements: content creation, PPC spend, third-party fees, staff salary (some argue that, as a fixed expense, this should not be counted), display ad spend, and so on. As your list of expenses becomes more detailed and precise over time, so too will your CAC result.
So if you spent $100 on a PPC campaign, and it resulted in five new customers, your CAC would be $20 (100 / 5 = 20).
By itself though, that $20 figure means nothing. You need context.
If they each bought your product for $15, you lost money. But if they each bought your deluxe, top-of-the-line product for $625, well then, you’ve done well my friend.
Back to the Golden Ratio
With that in mind, we can circle back to the Golden Ratio and Fundamental Law of Growth:
CLV / CAC > 3
In order to be successful, your CLV divided by your CAC should be three or more. You want a CLV:CAC ratio of 3:1. Hit that, and you’re golden.
Why? Depends on who you ask. Lower than that, and a company is spending too much bringing in new customers that aren’t worth enough over the long haul (less than one, and they’re actually losing money with each new customer). Higher, and that same company is using their capital more efficiently.
3:1 is the accepted wisdom across most industries. No matter the digital channel, the CLV:CAC ratio is a key metric to determine its overall efficiency. Track it, monitor it, use it.
Revenue to Cost Ratio
Besides aiming for the Golden Ratio, you’ll also want to track your revenue to cost ratio across all digital channels.
How much are you bringing in for every dollar that goes out?

The larger a company, the more convoluted this can get. But at its heart, you’re simply comparing the amount you spent on digital marketing to the amount of revenue it generated. No more, no less.
Yes, it can get complicated when you start breaking it down by individual channels and campaigns (you can find all the data you need from your third-party platforms, Google Analytics, and your own sales and marketing personnel), but it doesn’t have to be.
Even a general approach can provide insight and guidance. If you’re spending more than you’re making, you need to make some changes. Big changes. And fast.
A ratio of 5:1 is considered “good”. Anything over 10:1 is considered exceptional.
At 2:1 you’re probably breaking even, as the production or acquisition cost of goods sold is typically about 50% of the sale price. 1:1 and you’re losing money.
Of course, there are no absolutes, but those figures apply to most companies in most industries. You want to strive for 5:1 or higher…$5 of revenue for every $1 of marketing. Overall, by channel (blog, social media, video), and by campaign (semi-annual sale, back-to-school sale).
Does it take time and energy to crunch the numbers? Yes it does. But knowing exactly what’s working and delivering that magical 5:1 or better return is worth all that and more.
Some digital channels connect and engage long before an actual sale is made, so using “last touch” attribution and connecting the touch points with services like Kissmetrics, Marketo, or Hubspot can be handy (albeit expensive).
Search Engine Marketing
The paid ads on Google, Bing, and Yahoo can be an efficient channel to market your brand. Can be. There are no guarantees.
As with everything discussed so far, the trick is to track and monitor your ROI using the revenue to cost ratio.
Most search ad platforms are auction-based, so you’ll be competing for keywords against your competitors. How much should you be willing to pay for each click? The engine will always give you a suggestion. Outbid your competition, and your ad will be seen more often than theirs. Bid too low, and you’re essentially throwing money away and your ad will languish in the shadows.

Cost-Per-Click
So what’s a good cost-per-click (CPC)? It all depends on your target ROI, which should be a revenue to cost ratio of 5:1 (scroll up if you don’t remember why).
With that firmly in mind, do a little calculating. If you’re selling a product for $500, and you’ve historically been able to convert (i.e. sell) one for every 50 clicks (a 2% conversion rate, or CVR), then your target CPC should be $2.
Why? Because that gives you the perfect ratio…500:100, or 5:1. You made $500 in revenue from $100 (50 clicks at $2 each) in ad spend.
To find your ideal CPC, try this simple formula:
Target CPC = (Revenue Per Sale x Conversion Rate) x 20%
If you make $15,000 from each sale, and your industry sees an average conversion rate of 3.5%, then your target CPC would be $105.
If you don’t know your CVR, find your industry average and use that as a ballpark figure. If all else fails, try the Google Adwords search average for all industries of 2.70% (according to Search Engine Watch).
You may have to go above that CPC depending on what others are bidding, at which point you need to reconsider. Getting a keyword at the expense of your ratio will hurt your bottom line.
You might also be able to bid less than your target PCP, in which case…yay you! You’re well on your way to the promised land of 6:1, or 7:1, or 8:1, or…you get the idea.
Cost-Per-Click for Lead Generation
But not every PPC ad results in revenue, right? What if your campaign is about getting names and contact details? If you’re after leads and not sales, you can still calculate your ideal CPC by adding your close rate into the equation:
CPC = (Revenue per Sale x Conversion Rate x Close Rate) x 20%
If your sales department can usually convert one out of every ten leads into a sale, you have a close rate of 10%.
You want your paid ads – for both sales and leads – to be operating at or below your ideal CPC.
Email Marketing
Email marketing sometimes gets overlooked in the Facebook age. Sure, it’s digital, but it’s just so old-fashioned. The “digital” of our parents or grandparents.
But email is still doing okay for itself…if “okay” means ridiculously efficient and worthwhile:
- Email is 40x more effective at acquiring a new customer than both Facebook and Twitter.
- Email marketing delivers more conversions than any other channel according to Monetate.
- It has an average ROI of 3800%, and 20% of businesses have a ROI ratio of 70:1. That is not a typo.
And yet, email is the unappreciated middle child for far too many companies. But you’re not like that (you’re not, right?). Email works.
But does yours? Besides just using it in your marketing efforts (and you definitely need to use it), you also need to evaluate its effectiveness.
The Metrics That Matter
You’ll hear a lot about open rates. They’re nice, but “opening” is not “doing” (i.e. converting). Instead, focus on these metrics:
- Click-through rate. How many people are actually clicking on a link included in the email? CTR = (Total clicks / Total sent) * 100. A good CTR is somewhere between 2-4% for most industries. You can compare yours against MailChimp’s email marketing benchmarks.
- Conversion rate. How many people clicked and completed the call-to-action? CVR = (Total who completed / Total emails sent) * 100.
- Return on investment. How much are you getting back for every dollar you put in? ROI = [(Total sales made – cost of campaign) / cost of campaign] * 100.
There are others, but these three will quickly demonstrate how well your email marketing is getting results for you. Opens are nice, but clicks, conversions, and a positive ROI is infinitely better.
And there’s more good news. The major players here – MailChimp, AWeber, Campaign Monitor – make collecting this data crazy easy.
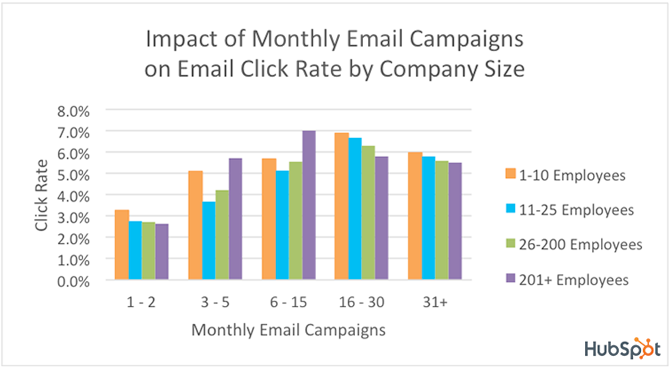
Track your performance. Use A/B testing to incrementally improve your clicks and conversions. Send enough, but not too much. Use an email marketing ROI calculator to compare your company to others of similar size and industry (you want to be better than the average). Work to get better than the average. Tweak to bring your ROI up from good to great, and from great to ludicrous.
(Image Source)
Do all that, and your email marketing = efficient.
In the digital marketing sphere, you want to be operating profitably. You want to be making more than you spend to make it.
You want the Golden Ration of 3:1 for CLV to CAC. You want the sweet spot of 5:1 for revenue to cost. If your marketing channels and campaigns are bringing in sales and leads and fall within those ratios, then they’re operating efficiently. If a channel is bringing in revenue but falling below those targets, then all is not sunshine and lollipops, and it’s time to tweak, refine, and/or cut bait.
Just don’t get hung up on them too rigidly. There is always a little wiggle room. A higher customer lifetime value can allow for a higher CPC or CAC on a first purchase. Amazon, for example, operates at a loss on their Kindle ebook reader because they know the average customer will be buying ebooks from them for years and years. In fact, Kindle owners spend an average of $1450 per year compared to only $725 for customers who don’t own the device. And ebooks require no warehouse, no shipping, and no production costs.
Digital marketing is the new king of the castle, but hitching your wagon to it without tracking and monitoring its performance is a bad idea.
3:1. 5:1 or better. That’s efficiency in the digital realm.
How are you tracking your digital marketing efficiency? What tools do you use? Leave your comments below:
Images: eMarketer, Marketing Charts, Pixabay, Pixabay, Hubspot